Trustek's 2026 Audit Data Analysis
.jpg)
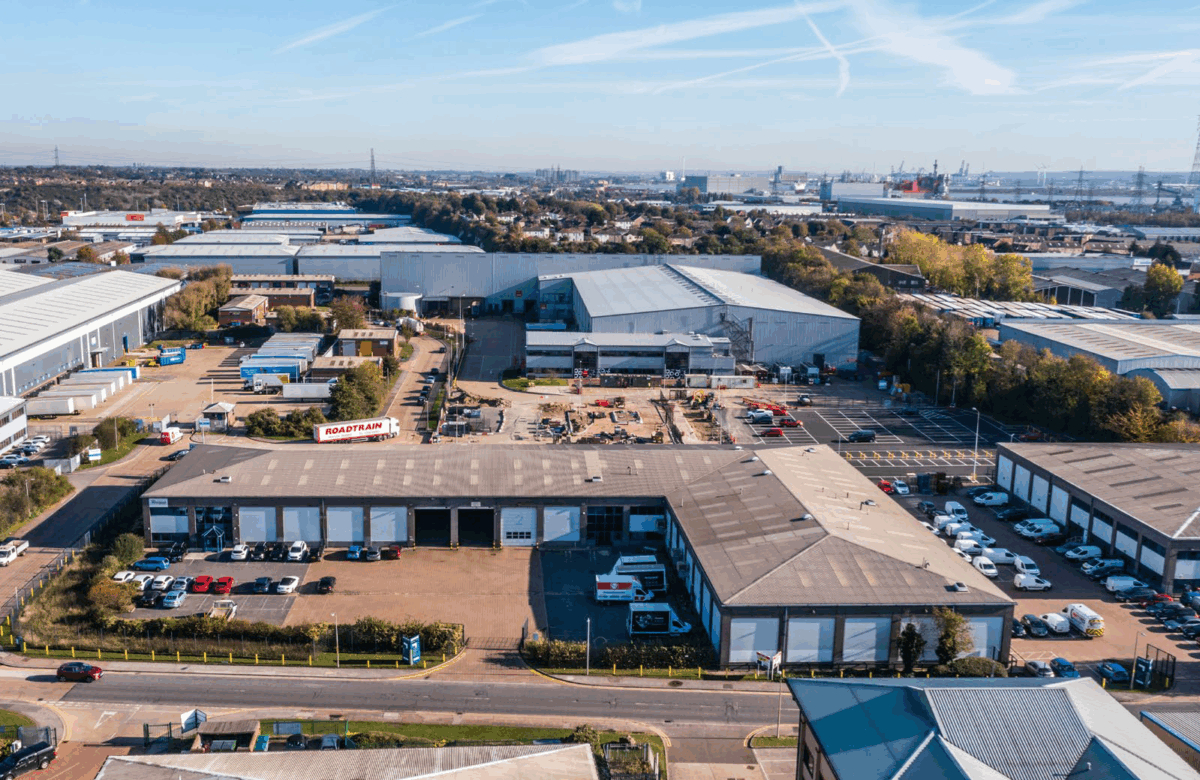
Trustek has completed technology audits across 178 commercial office and industrial buildings, covering more than 5.8 million sqft of real estate. This provides the most comprehensive view to date of current technology installations and remaining gaps in these properties.
Unlike our previous datasets, this year's sample focuses on office and industrial assets, excluding residential buildings entirely. As a result, the data offers a clearer perspective on technology adoption in workplace and logistics real estate.
Key Findings
- 178 buildings audited, totalling 5.8 million sqft
- Average building size: 35,655 sqft
- 1,207 individual technology instances recorded across the portfolio
- LED lighting is now standard: present in 82.6% of buildings
- People counting stays the rarest technology in the stack, at just 7.3%
2026 Audit Data: An Overview
Some technologies are now nearly universal across the portfolio, while others remain a genuine minority pursuit, even when their benefits are clear. The gap between the most and least adopted categories tells its own story about where investment and focus have been directed.
Top 5 Technologies: What Every Building Has
1. LED lighting: 82.6% (147 buildings)
LED retrofit has clearly won the argument. They have become the standard due to short payback periods and the obvious case of sustainability, and are now the closest thing to a baseline expectation across office and industrial stock.
2. Connectivity infrastructure: 76.4% (136 buildings)
Converged networks and building-wide connectivity are now firmly mainstream. As buildings incorporate more IoT devices and cloud-connected systems, a robust, ‘nice-to-have' network infrastructure has become foundational.
3. CCTV: 69.7% (124 buildings)
Security is still one of the earliest and most consistent technology investments for landlords, as reflected by widespread CCTV coverage.
4. Access control: 56.2% (100 buildings)
Just over half of the surveyed buildings have access control in place, which is useful not only for security but, when utilised effectively, provides valuable occupancy data for space planning and energy strategy.
5. Electricity AMRs: 55.1% (98 buildings)
Automatic meter reading for electricity has reached the majority of buildings, reflecting growing pressure to move away from manual readings and toward real, more detailed consumption data.
Bottom 5 Technologies: Where the Gaps Are
19. People counting: 7.3% (13 buildings)
The lowest-scoring category by some distance. People counting is one of the more affordable ways to generate genuine occupancy insight, yet it remains rare. This is a missed opportunity for landlords looking to optimise space usage and energy consumption.
18. Cybersecurity: 13.5% (24 buildings)
As building systems become increasingly networked and cloud-connected, formal cybersecurity measures are still the exception rather than the rule. With connectivity infrastructure adoption rising (76.4%, see above), this gap warrants close attention.
17. Air quality: 14.6% (26 buildings)
Despite growing tenant demand for wellness features and credentials, indoor air quality monitoring is still uncommon. This is one of the more visible disconnects between what occupiers say they want and what’s really being installed.
16. Building Energy Management Systems (BEMS): 16.3% (29 buildings)
BEMS adoption lags well behind basic BMS platforms, meaning many buildings can log data but can't yet act on it automatically. This ends up limiting how quickly energy savings can be realised.
15. Tenant engagement app: 16.9% (30 buildings, tied with Gas AMRs)
Fewer than one in six buildings has a tenant engagement app. Given the importance of these platforms to modern occupier experience strategies, this remains a notable and surprising gap in the portfolio. See below for the comparison with our 2023 data.
What This Means for Office and Industrial Landlords
The trend is clear: technologies with a strong, near-universal business case (such as LED lighting, connectivity, and CCTV) have become standard. Technologies that require more deliberate investment of time and capital (including people counting, air quality, BEMS, and dedicated cybersecurity) remain inconsistent, even when they could meaningfully enhance data, sustainability, or wellness credentials.
For landloards benchmarking their own assets, matching the top five technologies aligns a building with the markets. Closing the gap on the bottom five offers opportunities for genuine differentiation, and often more cost-effective improvements.
2023 vs 2026: How the Portfolio Has Shifted
Comparing this year’s data to our 2023 audit findings gives an early indication of adoption trends. A caveat: the 2023 dataset spanned a broader mix of asset types, including residential, and used a weighted scoring system. In comparison, the figures below reflect simple technology presence in commercial and industrial buildings alone. These results should be treated as directional signals of where the market is heading, not a strict re-audit of the same buildings.
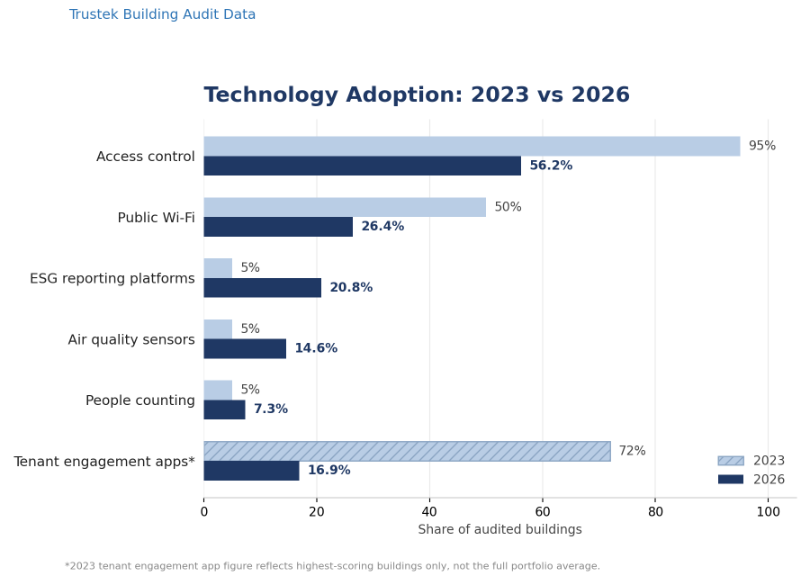
- Access control: 95% of assets (2023) → 56.2% (2026). The biggest shift in the data. Access control was our highest-scoring category in 2023; on a straight presence basis across today's office and industrial portfolio, barely half of buildings have it installed.
- Public Wi-Fi: 50% (2023) → 26.4% (2026). A notable decline, though this likely reflects the narrower office/industrial sample rather than buildings actively removing existing Wi-Fi.
- ESG reporting platforms: 5% (2023) → 20.8% (2026). A four-fold increase, consistent with the 130% rise in ESG strategies we flagged in 2023, finally showing up in the technology stack itself.
- Air quality sensors: 5% (2023) → 14.6% (2026). Slow but real progress on a technology we called out as a wellness differentiator three years ago.
- People counting: 5% (2023) → 7.3% (2026). Still the rarest technology in the stack both times. The case for it hasn't yet translated into adoption.
- Tenant engagement apps: In 2023, 72% of the highest-scoring buildings for tenant experience had an app already in place. Three years later, adoption across the full portfolio is just 16.9%, suggesting the technology hasn’t yet reached mainstream adoption.
Looking Ahead
As ESG reporting requirements tighten and tenants continue to expect greater transparency on energy use, air quality, and space utilisation, we'd expect several of today's “bottom 5” categories to see higher adoption in the next audit cycle. Tenant engagement and BEMS adoption in particular look like the next candidates to follow the same upward trajectory ESG reporting and air quality sensors have already shown since 2023.
If you'd like to see how your building compares against this data set, get in touch with the Trustek team.
Image source: AXP Photography, Pexels
More Case Studies